Coexistence View - Throughput Indicators

Coexistence View Throughput Indicators
Throughput indicatorsshow average throughput and 1 second throughput for Classic Bluetooth® (all devices, master devices, and slave devices are each shown separately), Bluetooth low energy, and 802.11.
Throughput

Throughput is total packet or payload size in bits of the included packets divided by the duration of the included packets, where:
- Packet size is used if the Packet or Both radio button is selected in the Throughput group.
Payload size is used if the Payload radio button is selected in the Throughput group.
- Included packets are defined separately for each of the radio buttons that appear above the throughput indicators.
- Duration of the included packets is measured from the beginning of the first included packet to the end of the last included packet.
Radio buttons
The radio buttons above the throughput indicators specify which packets are included. Radio button descriptions are modified per the following:
Bluetooth low energy packets from non-configured devices are excluded if the Configured radio button in the LE Devices group is selected.
- Frame Display filtering has no effect here in that packets that are filtered-out in Frame Display are still used here as long as they otherwise meet the criteria for each radio button as described below.
All radio button
All packets are used for average throughput, and packets occurring in the last 1 second of the session are used for 1 second throughput, except that Bluetooth low energy packets from non-configured devices can be excluded as noted above.
Selected radio button
Selected packets (the selected packet range is shown in the timeline header) are used for average throughput, and packets in the 1 second duration ending at the end of the last selected packet are used for 1 second, except that Bluetooth low energy packets from non-configured devices can be excluded as noted above.

Timeline Header Showing Selected Packets
Viewport radio button
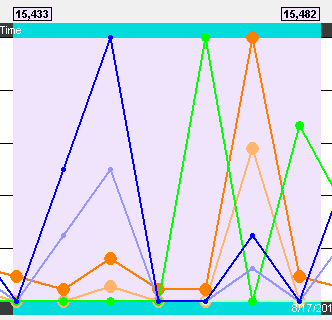
The viewport is the purple rectangle in the Throughput Graph and indicates a specific starting time, ending time, and resulting duration. Packets that occur within that range of time are used for average throughput, and packets in the 1 second duration ending at the end of the last packet in the viewport time range are used for 1 second throughput, except that Bluetooth low energy packets from non-configured devices can be excluded as noted above.

Throughput Graph viewport.
Indicator width
The width of each indicator is the largest 1 second throughput seen up to that point for that technology (Classic Bluetooth, Bluetooth low energy, or 802.11), where the 1 second throughput is calculated anew each time another packet is received. The 1 second throughput indicator will never exceed this width, but the average throughput indicator can. For example, the image below has a large average throughput because the Selected radio button was selected and a single packet was selected, and the duration in that case is the duration of the single packet, which makes for a very small denominator in the throughput calculation. When the average throughput exceeds the indicator width, a plus sign (+) is drawn at the right end of the indicator.

Average throughput indicators show a plus sign (+) when the indicator width is exceeded.

A single selected packet